How Molecular Sieve Beds Work — Adsorption Fundamentals
A molecular sieve bed is not a passive filter tank. It is a dynamic mass-transfer system whose performance depends on three interacting phenomena: selective adsorption at the molecular level, zone migration inside the packed bed, and thermal cycling that restores capacity.
At the heart of the process is the zeolite crystal — an aluminosilicate with uniform pore channels measured in ångströms. Type 4A molecular sieve, the standard choice for natural gas dehydration in LNG service, has channel diameters of roughly 4 Å. Water molecules, with a kinetic diameter of about 2.65 Å based on the commonly used Breck (1974) dataset, enter these channels freely and are trapped by the polar environment inside. Larger hydrocarbon molecules are excluded — a dual mechanism of physical sieving and polarity-driven affinity that lets molecular sieves reach water specifications below 0.1 ppmv, a threshold no other desiccant can hold at scale.
Inside the vessel, the bed develops two distinct zones during adsorption. The upper portion — the saturation zone (SZ) — has already reached equilibrium with the wet feed gas and can hold no additional water. Below it sits the mass-transfer zone (MTZ): the active region where water transfers from the gas phase onto the adsorbent surface. As adsorption proceeds, the MTZ migrates downward. When its leading edge reaches the bed outlet, breakthrough occurs and the bed must be taken offline for regeneration.
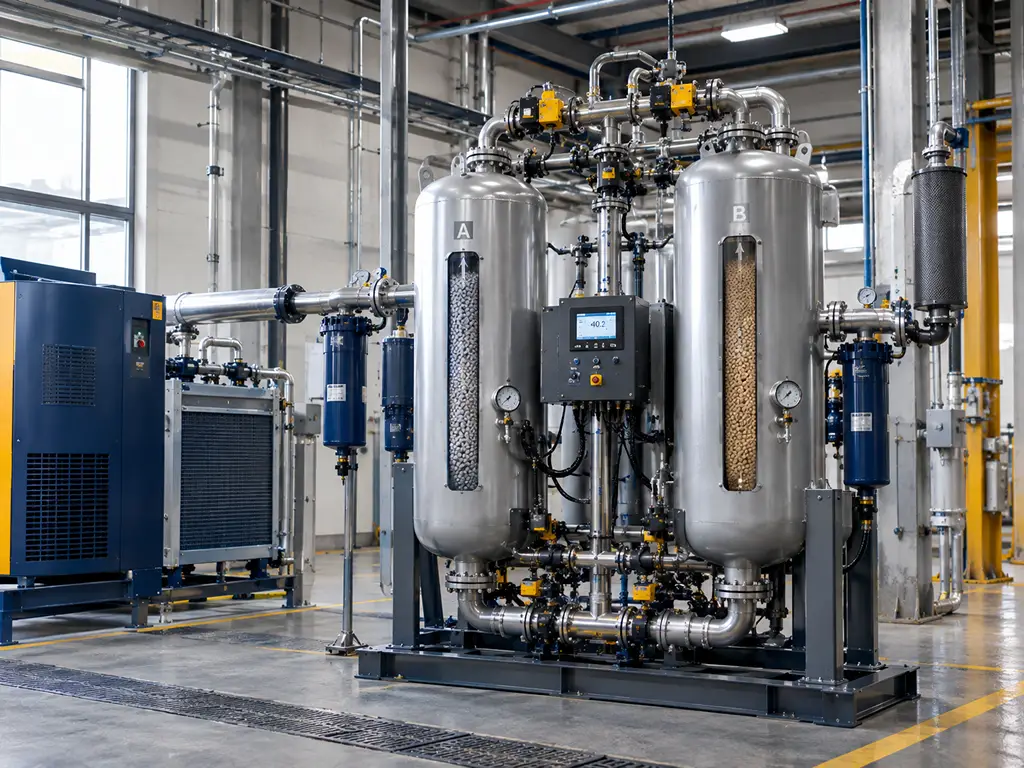
Because adsorption is inherently a batch process, practical systems use at least two vessels cycling between adsorption and regeneration. A 2+1 configuration — two beds in adsorption, one in regeneration — is common in LNG trains. The cyclic nature of the operation means every design decision, from vessel diameter to regeneration heating rate, plays out across thousands of cycles over a 3- to 5-year service life.
Selecting the Right Molecular Sieve Type for Your Bed
Molecular sieve selection is the first fork in the design road. Choose wrong, and every downstream calculation rests on assumptions that do not match the real process.
| Type | Channel Diameter | Typical Cation | Preferred Application | Watch Out For |
|---|---|---|---|---|
| 3A | ~3 Å | K⁺ | Pipeline gas dehydration where methanol is injected for hydrate inhibition; ethanol dehydration to fuel-grade | Lowest water capacity of the A-type family |
| 4A | ~4 Å | Na⁺ | LNG pretreatment dehydration; general natural gas deep drying | Co-adsorbs some CO₂ — regeneration gas routing matters |
| 5A | ~5 Å | Ca²⁺ | Simultaneous water and mercaptan removal; normal paraffin separation | Co-adsorption of heavier hydrocarbons adds regeneration complexity |
| 13X | ~10 Å | Na⁺ | Air separation pre-purification; CO₂ removal; sulfur species adsorption | Broadest co-adsorption profile — regeneration gas almost always requires separate treatment |
The decision rule is straightforward. For dehydration-only service where the gas heads to a cryogenic process, 4A is the workhorse — it offers higher water capacity than 3A with less co-adsorption than 5A. For pipeline gas where methanol injection prevents hydrates upstream, 3A is mandatory: methanol passes through its smaller pores without consuming bed capacity. For air separation or bulk contaminant removal, the larger pores of 13X handle the multi-component challenge. Specialty types — CaX for high-capacity dehydration at elevated temperatures, LiLSX for PSA oxygen generation exceeding 90 percent purity — fill niche roles but follow the same selection logic: match the pore size and cation chemistry to the molecules you need to capture and those you need to let pass.
Core Bed Sizing — Diameter, Height, and Bed Weight
Bed sizing is a constraint-satisfaction problem, not an optimization problem. Flow rate, pressure drop budget, and end-of-run capacity form an iron triangle — push any one and the other two push back. Your job is to find the feasible region, not the theoretical optimum.

Gas Flow Direction and Bed Orientation
Adsorption gas flows downward. This is not convention — it is physics: the weight of the bed counteracts the upward drag force of the gas, preventing fluidization under abnormal flow conditions. Regeneration gas flows upward, which means the bottom of the bed — closest to the outlet during adsorption and therefore the last line of defense against breakthrough — is heated and dried first. Reversing these directions invites two failure modes: downward regeneration leaves the critical bottom zone regenerated last, while upward adsorption risks lifting the bed at high flow rates, causing particle attrition, dust generation, and eventual channeling.
Calculating Bed Diameter from Superficial Velocity
Diameter is the one variable that fluid mechanics alone determines. The design sequence runs as follows.
First, establish the allowable pressure drop. In LNG and NGL extraction plants where every kilopascal of ΔP carries an economic penalty, design practice limits the clean-bed ΔP to less than 60 kPa — roughly 5 to 8 psi (GPSA Engineering Data Book, 13th ed.). At end-of-run, when dust accumulation and partial pore blockage have taken their toll, the ΔP typically doubles to about 120 kPa. That end-of-run value is what the vessel’s support structures must tolerate.
Second, determine the maximum allowable superficial velocity. The Ergun equation — or the GPSA’s simplified form, ΔP/L = B·μ·Vg + C·ρ·Vg² — relates pressure drop per unit bed depth to gas velocity, viscosity, and density. Solving this for the ΔP budget gives the superficial velocity ceiling. An absolute upper bound of roughly 0.2 m/s applies regardless of what the equation permits: above this threshold, particle attrition accelerates sharply. At the low end, a minimum Reynolds number of 40 keeps the flow turbulent and the radial gas distribution even. Operating velocity should target 60 to 70 percent of the fluidization velocity as an additional safety margin.
Third, from the design gas flow rate and the allowable superficial velocity, calculate the required bed cross-sectional area — and from that, the vessel inside diameter. A practical rule of thumb keeps the bed length-to-diameter ratio above 2:1. Below this, the vessel turns into a “pancake reactor” where most of the steel cost ends up in the top and bottom heads rather than in straight-side height.
Determining Bed Height and MTZ Allowance
With diameter fixed, bed height follows from the water removal duty. For Type 4A molecular sieve at standard conditions, fresh equilibrium loading reaches roughly 23 weight percent water. After regeneration, a residual loading of about 4 weight percent remains — water the heating cycle could not economically remove. An additional 5 percent of the total bed weight goes to the mass-transfer zone, which never reaches full saturation by design. The usable loading for a fresh bed is therefore roughly 18 weight percent.
Divide the total water load per cycle — feed water content times flow rate times adsorption time — by the usable loading, and you get the required mass of molecular sieve. From the bulk density of the packed bed and the already-determined cross-sectional area, bed height follows directly. In practice, single-bed heights rarely exceed 10 meters. Above that, the vessel dominates the plant skyline and the particles at the bottom face a crushing load equal to the pressure drop plus the saturated bed weight.
A final layer-design decision: use larger particles in the top portion — typically 1/8-inch (3 mm) pellets — to minimize overall pressure drop, while the bottom layer gets 1/16-inch (1.5 mm) particles whose higher surface-area-to-volume ratio tightens the mass-transfer zone.
Setting Cycle Time and Standby Margin
A typical adsorption period lasts 12 to 16 hours. In a 2+1 configuration, the total cycle time is 24 hours: two beds share the adsorption duty sequentially while the third completes its regeneration within an 8-hour window. A 1+1 configuration stretches the cycle to 32 hours, giving each bed a more generous 16-hour regeneration window — but at the cost of larger vessels to handle the longer adsorption duty on a single bed.
Standby time — the buffer between the end of cooling and the next adsorption cycle — is not wasted. As the bed ages and its effective capacity declines, standby absorbs the resulting shortening of the adsorption period. In fixed-cycle systems, standby time is the single most accessible lever for extending bed life without hardware changes.
Bed Internal Design — Supports, Screens, and Layer Configuration
Bed internals sit at the intersection of process design and mechanical engineering — and most design guides go silent right at this intersection. A perfectly sized bed that channels flow or collapses its support screen fails within months, not years. These are not details to toss over the fence to the mechanical team. They are core design decisions with direct process consequences.
Johnson Screens and Bed Support — The First Line of Defense
Consider a failure described in field reports: one dehydration unit’s Johnson screens collapsed less than two years into a planned three-year service life. The root cause was not a manufacturing defect. Upstream knockout drum underperformance allowed liquid slugs to reach the bed, and pressure drop excursions pushed beyond the design envelope. The screens themselves were rated for roughly 2 bar of differential pressure, including the weight of the saturated molecular sieve bed above them. Liquid slug impacts, however, generate instantaneous loads several multiples of the steady-state design value.
Proper screen specification starts with three parameters. Slot width must be smaller than the smallest molecular sieve particle to prevent media loss. Open area must balance mechanical strength against uniform flow distribution. Material temperature rating must tolerate the 320°C peak regeneration temperature of 4A sieves without losing mechanical properties. Some operators, after experiencing screen failures, have proposed replacing Johnson screens entirely with deep ceramic ball beds. The engineering community has largely rejected this: ceramic balls alone cannot provide the uniform flow resistance that ensures even regeneration gas distribution, and the resulting channeling produces incomplete regeneration that accelerates capacity loss.
Ceramic Ball Grading — More Than Just Filler
Ceramic balls do three things: they support the molecular sieve bed structurally, distribute gas flow evenly across the vessel cross-section, and protect the sieve material from direct high-velocity gas impingement at the inlet nozzle. The golden rule of grading: adjacent layers must differ in particle diameter by no more than a factor of two. A 1-inch ball over a 1/2-inch ball over a 1/4-inch ball is safe. A 1-inch ball directly above a 1/4-inch ball risks the smaller particles migrating into the gaps between the larger ones, creating preferential flow paths and eventual channeling.
High-alumina ceramic balls — typically 99 percent or higher Al₂O₃ content — are the standard material, with each layer usually 100 to 150 millimeters deep. The bottom-most layer, directly above the support screen, may extend to 200 millimeters.
Inlet Distributor and Flow Equalization
The inlet distributor converts a high-velocity point flow from the feed pipe into a low-velocity plane flow covering the full bed cross-section. Without adequate freeboard — the open space between the distributor outlet and the top of the bed — the gas jet hits a small area of the bed surface, eroding particles and carving a depression that channels flow. Industry practice calls for a freeboard height of at least 30 to 50 percent of the bed diameter, and never less than 300 to 500 millimeters. The same requirement applies to the bottom of the vessel, where regeneration gas enters from below during the heating and cooling cycles.
Regeneration System Design Parameters
Regeneration is not “heat it until it is dry.” The way you apply heat determines whether the bed degrades gracefully over thousands of cycles or fails catastrophically in dozens.
The critical failure mechanism is hot liquid water formation. At the start of regeneration, the bottom portion of the bed — exposed to the incoming hot gas first — desorbs its water. That water vapor travels upward into the still-cold upper portion of the bed, where it condenses back into liquid water at a temperature well above ambient. Hot liquid water attacks the clay binder that holds the zeolite crystals together. It dissolves the binder and, as the bed continues heating, bakes the dissolved material into a hard cake. The result: permanent capacity loss, concentrated in the region where channeling later develops.
The defense is a controlled heating ramp. Heating rate depends on bed size, thermal response, and application: large LNG trains typically use a conservative ramp of 25 to 50°C per hour, while smaller units may tolerate faster ramps when their temperature profile and regeneration system have been validated. For a large bed, gradual heating allows the upper section to preheat before the bulk of the desorbed water reaches it. A plateau at 180 to 200°C gives the desorbed water time to evaporate and exit the bed. Then the final push to 280 to 320°C completes the regeneration. This three-stage profile — ramp, hold, final heat — is documented in the landmark two-part series by Herold and Mokhatab (Gas Processing News, 2017) and represents the industry consensus for maximizing sieve lifetime.
Regeneration gas flow rate typically runs 8 to 12 percent of the feed gas flow — enough to carry the required heat into the bed while staying below fluidization velocity during upflow. After heating, a cooling step brings the bed back to adsorption temperature using unheated dry gas. The cooling endpoint: when the bed outlet temperature drops to within 10 to 15°C of the feed temperature. Any hotter, and the bed enters adsorption with reduced effective capacity.
Pressure Drop and Velocity Optimization
Pressure drop is not a box to tick after the real design work is done. It is an economic variable that constrains diameter, drives energy consumption, and — tracked over time — signals bed health before anything else does.
| Criterion | Value | Why It Matters | Corrective Action |
|---|---|---|---|
| Maximum superficial velocity | ≤ 0.2 m/s | Absolute ceiling for particle attrition control | Increase bed diameter |
| Minimum ΔP/L | ≥ 230 Pa/m | Ensures radial gas distribution; prevents flow maldistribution | Reduce diameter or increase bed height |
| Minimum Reynolds number | ≥ 40 | Turbulent flow required for uniform distribution | Increase velocity or use smaller particles |
| LNG clean-bed ΔP budget | < 60 kPa (~5–8 psi) | Economic limit; each kPa carries a liquefaction efficiency penalty | Increase diameter |
| End-of-run ΔP | ~1.5–2× clean-bed value | Dust and pore blockage accumulation; support structures must tolerate this | Plan changeout when ΔP doubles |
| Operating vs. fluidization velocity | ≤ 60–70% of fluidization velocity | Safety margin against bed lifting during upflow steps | Reduce regeneration gas rate or increase diameter |
Beyond design, pressure drop is the most accessible real-time indicator of bed condition. Every molecular sieve unit should establish a clean-bed ΔP baseline at commissioning, recorded at the design flow rate and temperature. When the operating ΔP hits 1.5 to 2 times that baseline, schedule an internal inspection and a sieve sample analysis. Rising ΔP rarely reverses — it is the cumulative signature of dust generation, particle attrition, and gradual pore blockage.
Designing for End-of-Run — Lifecycle Performance as the Real Target
The bed that meets spec at commissioning and the bed that meets spec after 1,500 cycles are two different designs. End-of-run is the real design point. Everything before that is borrowed time.
Understanding Capacity Decline — Deactivation Mechanisms
Molecular sieve capacity follows an S-shaped decline curve. The first 200 to 300 cycles see a relatively steep drop as the bed settles from its fresh, optimistic state into steady operating conditions. A long middle plateau — roughly cycles 300 to 800 — delivers relatively stable performance. Beyond about 800 cycles, degradation accelerates: cumulative thermal stress, coke deposition, and irreversible binder damage compound until the bed can no longer hold the required water load.
Among the deactivation mechanisms, hot liquid water damage during regeneration ranks first. A single poorly executed regeneration cycle can permanently destroy 10 to 20 percent of the bed’s effective capacity — damage no subsequent regeneration can reverse. Coke deposition from heavy hydrocarbons ranks second: during regeneration, hydrocarbons adsorbed onto the clay binder decompose at high temperature, leaving carbon residue that blocks micropores. Upstream contamination — amine, glycol, compressor oil, or corrosion inhibitor carryover — coats the external surface of the molecular sieve particles, physically shielding the pore entrances. Thermal cycling fatigue, by contrast, is the slowest and least significant deactivation pathway. Field experience consistently ranks upstream contamination and regeneration discipline above thermal cycling as drivers of capacity loss.
Performance Test Runs — Measuring Where You Really Are
A performance test run is the only objective basis for deciding when to change out a molecular sieve bed. The short-cut method from John M. Campbell’s Gas Conditioning and Processing series uses two simple equations. First, calculate the breakthrough loading:
BTL (wt%) = 100 × (adsorption time in hours × water removed in kg/h) ÷ (mass of molecular sieve in bed in kg)
Then convert to the life factor: FL = BTL / 18, where 18 represents the approximate fresh effective loading for 4A molecular sieve. Plot the current FL against cumulative cycle count on a generic molecular sieve decline curve — and compare it against the design FL point — to get a forward-looking estimate of remaining life. Run at least one PTR per year, and add a test after any significant process upset such as a liquid carryover event.
Changeout Planning and Variable Cycling Strategy
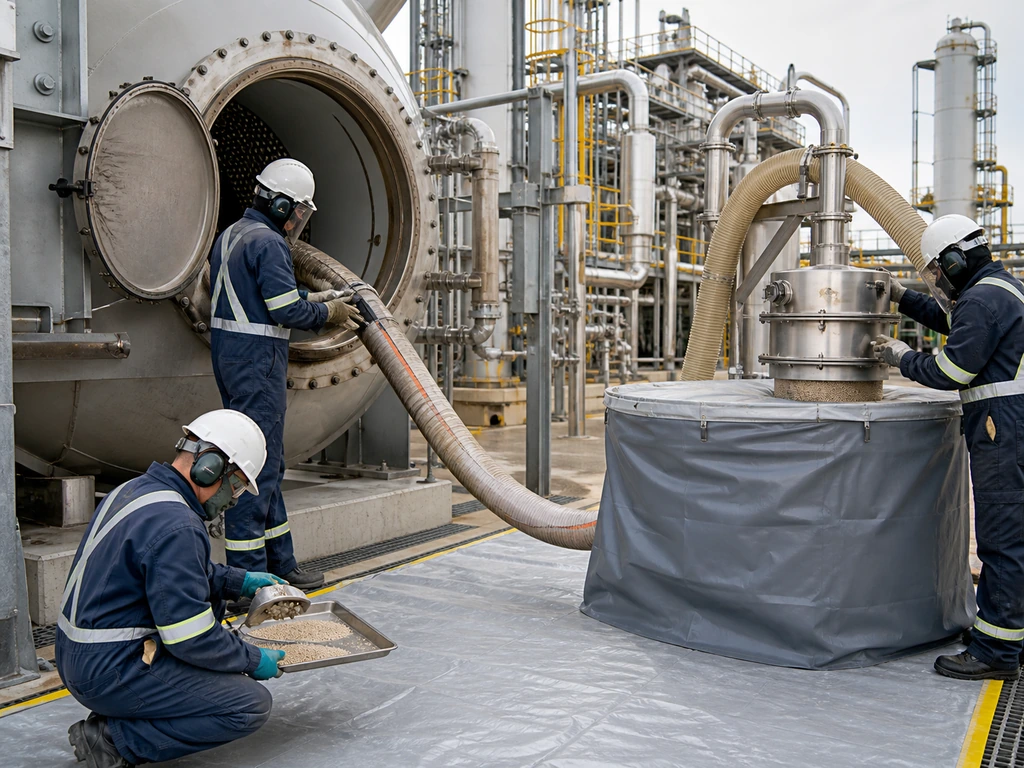
Three hard indicators trigger a changeout decision: end-of-run BTL falling below the minimum required for the current feed water load, pressure drop exceeding twice the clean-bed baseline, or rising outlet moisture content approaching the specification limit. Planning should begin when the PTR-predicted remaining life drops below the interval to the next planned major turnaround — typically four years for LNG facilities.
Variable cycling puts the excess capacity of a fresh bed to work. When the bed is new and its capacity far exceeds the minimum requirement, extending the adsorption cycle by 20 to 30 percent cuts the number of regeneration cycles per year, directly slowing the capacity decline curve. Over three years, variable cycling can reduce the cumulative cycle count by 15 to 20 percent, adding six months to a year of bed life. The trade-off is operational: variable cycles demand more active monitoring and a clear decision process for when to adjust timing, which is why many plants default to fixed cycles despite the economic penalty.
Batch-to-batch consistency in crush strength and adsorption capacity often matters more than nominal specifications. Request a per-batch certificate of analysis with measured values and stated test methods, rather than relying only on broad datasheet ranges.
Protecting the Bed — Inlet Separation and Contamination Control
A molecular sieve bed cannot protect itself. The equipment upstream of the vessel determines whether the bed reaches its design life or fails early from contamination — and by the time you see the damage in the bed, the upstream problem has been running unchecked for months.
Three equipment items form the minimum protection train. First, a high-efficiency filter coalescer removes entrained liquid droplets and solid particles down to sub-micron levels — typically 0.3 to 1.0 μm — while reducing downstream liquid content to trace levels. The final specification should be selected for the feed composition and downstream equipment rather than treated as a universal value. Second, a knockout drum provides surge volume for liquid slugs — the primary cause of bed fracturing — and acts as a bulk liquid separator upstream of the coalescer. Third, a dry gas particulate filter downstream of the molecular sieve vessel catches desiccant fines before they reach compressors, cryogenic heat exchangers, or catalyst beds.
Free water is the most damaging contaminant: a single slug event can fracture the molecular sieve bed, creating fines that drive up pressure drop and preferential flow paths that cause early breakthrough. Heavy hydrocarbons — particularly compressor lubricating oil — burn onto the adsorbent surface during high-temperature regeneration, forming coke that progressively eats away capacity. Chemical contaminants such as amine, glycol, and corrosion inhibitors coat the external surface of the molecular sieve particles, physically blocking access to the internal pore structure. Keep the feed gas temperature 5 to 10°C above the hydrate formation temperature — warm enough to prevent hydrates from forming in the bed, cool enough to maximize water adsorption capacity.
References
- Herold, R.H.M. and Mokhatab, S. Optimal Design and Operation of Molecular Sieve Gas Dehydration Units — Part 1. Gas Processing News, August 2017.
- Malino, H.M. A Short Cut Method for Evaluating Molecular Sieve Performance. PetroSkills — John M. Campbell, Tip of the Month, May 2019.
- Campbell, J.M. Gas Conditioning and Processing, Volume 2: The Equipment Modules, 9th Edition. Editors Hubbard, R. and Snow-McGregor, K. Campbell Petroleum Series, Norman, Oklahoma, 2018.
- GPSA Engineering Data Book, 13th Edition. Gas Processors Suppliers Association, Tulsa, Oklahoma.
- Breck, D.W. Zeolite Molecular Sieves: Structure, Chemistry, and Use. John Wiley & Sons, 1974.
- Imubit. Optimizing Molecular Sieve Dehydration in LNG Operations. 2024.
- Pall Corporation. Molecular Sieve Dehydration in Natural Gas.



 EN
EN  DE
DE  ES
ES  JA
JA  RU
RU  PT
PT  FR
FR  AR
AR  KO
KO  TH
TH  ID
ID